Hypothesis Testing: Proportion Tests Without Bootstrapping and Chi-Squared Tests
This post is the third of a four-part series on Hypothesis Testing. Part 1 here. Part 2 here. Part 4 here.
Welcome back to my journey through prepping for the Google Product Analyst interview! Today we are going to go back to the proportion testing we did in part 1, but use a workaround to avoid having to bootstrap. Then, we’ll extend our proportion tests to more than two groups using the Chi-Square test of independence. Finally, we’ll use the Chi-Square goodness-of-fit test to compare a distribution of proportions to a hypothesized distribution.
As with the last two posts in this series, this blog post is a review of the DataCamp course Hypothesis Testing in Python taught by James Chapman. However, you don’t need to have DataCamp access in order to follow along with the concepts presented here.
1. Proportion Testing without Bootstrapping
Comparing a Porportion to a Hypothesized Value
Recall from Part 1 that a proportion test measures whether a claim about an unknown population parameter, $p$, is feasible. The following steps are taken:
- Decide on significance level, $\alpha$ and write out $H_0$ and $H_A$.
- Calculate the standard error of the sample statistic from the bootstrap distribution.
- Calculate the standardized test statistic (z-score).
- Compute the p-value by passing the z-score to
norm.cdf() - Decide which hypothesis makes sense by comparing the p-value to $\alpha$.
Calculating a bootstrap distribution can be computationally expensive. So we’re going to go through a way to calculate the standard error without running a bootstrap distribution. Let’s go over a few key variables.
\(p = \text{population proportion}\) \(\hat{p} = \text{sample proportion}\) \(p_0 = \text{hypothesized population proportion}\)
Recalling from Sampling and Bootstrapping that the mean of a sampling distribution of sample means is equal to p, the z-score is given by:
\[z = \frac{\hat{p}-mean(\hat{p})}{SE(\hat{p})} = \frac{\hat{p}-p}{SE(\hat{p})}\]Of course, we don’t know what $p$ is, but under the assumption that $H_0$ is true, $p = p_0$. Thus, we can replace $p$ with $p_0$ and we get the following:
\[z = \frac{\hat{p}-p_0}{SE(\hat{p})}\]Under $H_0$, the standard error of $\hat{p}$ is given by
\[SE_\hat{p} = \sqrt{\frac{p_0 * (1-p_0)}{n}}\]Thus, $SE_\hat{p}$ depends only on the hypothesized $p_0$ and the sample size, $n$.
Assuming $H_0$ is true, the z-score now only uses the sample information ($\hat{p}$ and $n$) and the hypothesized parameter $p_0$.
\[z = \frac{\hat{p}-p_0}{\sqrt{\frac{p_0 * (1-p_0)}{n}}}\]Awesome!!
Let’s go back to our Stack Overflow dataset used as an example in the course. In this dataset, there’s a categorical variable for age given as one of two values, “At least 30” and “Under 30”. Let us hypothesize the following:
\(H_0: \text{The proportion of S.O. users under 30} = 0.5\) \(H_A: \text{The proportion of S.O. users under 30} \neq 0.5\)
Let’s set an $\alpha = 0.01$.
To get the sample proportions for each group in Python using Pandas, you would do
stack_overflow['age_cat'].value_counts(normalize=True)
which would yield
Under 30        0.53604
At least 30     0.46439
$n$ is given by len(stack_overflow) which is 2261.
Plugging these values into the z-score yields approximately 3.4.
Recall for a right-tailed test the p-value is calculated as $\text{1-norm.cdf(z-score)}$ and for a left-tailed test it is $\text{norm.cdf(z-score)}$. For a two-tailed test, we want the probability that the p-value lies in either of the two tails, so we calculate the sum of these. Plugging in our z-score, we get a p-value of 0.0007, much smaller than our $\alpha$. We can reject the null hypothesis that the proportion of Stack Overflow users under age 30 is equal to 50%.
Comparing Two Proportions
We can also compare two proportions across another categorical variable. In the Stack Overflow dataset, there’s a column called 'hobbyist' with values of either 'Yes' or 'No', showing whether a user self-describes as a hobbyist programmer. We want to know about the following hypotheses:
\(H_0: \text{The proportion of S.O. hobbyist users is the same}\) \(\text{for the under 30 category as those who are at least 30.}\) \(H_A: \text{The proportion of S.O. hobbyist users is not the same}\) \(\text{for the under 30 category as those who are at least 30.}\)
Again, let’s start by setting our $\alpha$, this time to $0.05$.
The z-score is as follows:
\[z = \frac{(\hat{p}_{\geq 30} - \hat{p}_{< 30})-0}{SE(\hat{p}_{\geq 30} - \hat{p}_{< 30})}\]The standard error for $\hat{p}_ {\geq 30} - \hat{p}_ {< 30}$ is rather ugly, but it can be broken down easily.
\[SE_{\hat{p}_{\geq 30} - \hat{p}_{< 30}} = \sqrt{\frac{\hat{p} * (1 - \hat{p})}{n_{\geq 30}} + \frac{\hat{p} * (1 - \hat{p})}{n_{< 30}}}\]where $\hat{p}$ is the pooled estimate of $\hat{p}_ {\geq 30}$ and $\hat{p}_ {< 30}$. It’s given as follows:
\[\hat{p} = \frac{n_{\geq 30} * \hat{p}_ {\geq 30} + n_{< 30} * \hat{p}_ {< 30}}{n_{\geq 30} + n_{< 30}}\]This is a lot of arithmetic, but thankfully that’s all really easy with Python! In fact, you can avoid it entirely (aren’t you glad I told you now?) by using proportions_ztest from the statsmodels.stats.proportion package, as follows:
from statsmodels.stats.proportion import proportions_ztest

proportions_z_test(
    counts=yeses,
    nobs=n,
    alternative='two-sided'
    )
This returns both your z-score and the p-value, which means all you have to do is compare it to your chosen $\alpha$.
2. Chi-Square Test of Independence for Proportion Tests of More Than Two Groups
Just as ANOVA extends t-tests to more than two groups, the chi-square test of independence extends proportion tests to more than two groups.
Two categorical variables are considered statistically independent if the proportion of successes in the response variable is the same across all categories of the explanatory variable.
To illustrate this, we’re going to consider two categories of the Stack Overflow data that we’ve already seen: age_cat = ['Under 30', 'At least 30'] and job_satisfaction = ['Very Satisfied', 'Slightly Satisfied', 'Neither', 'Slightly Dissatisfied', 'Very Dissatisfied']. We will pose the question, are age categories indpendent of job satisfaction levels? Our hypotheses are:
\(H_0: \text{Age categories are independent of job satisfaction levels}\) \(H_A: \text{Age categories are not independent of job satisfaction levels}\)
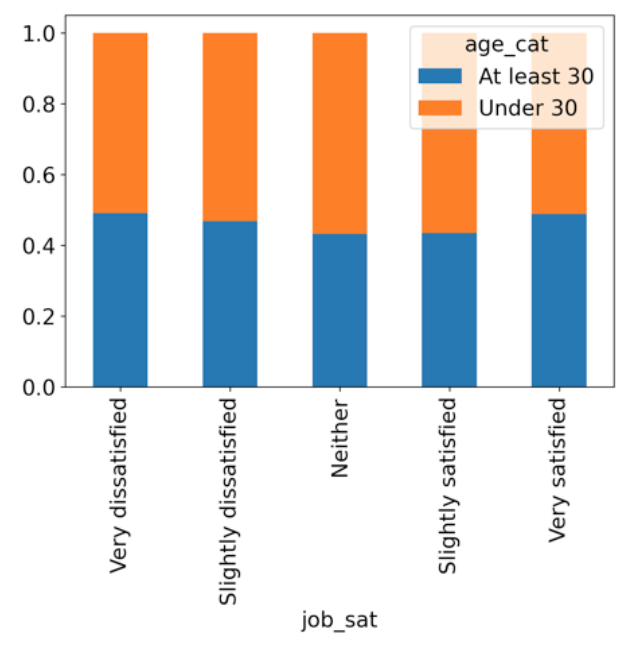
To illustrate this, let’s look at a stacked bar graph of age categories by job satisfaction levels.

As you can see, all categories appear to have roughly the same proportion of under-30-year-olds. But are they truly the same? This will determine whether or not age category and job satisfaction levels are independent.
Let’s set an $\alpha$ of $0.01$. Our test statistic is $\chi^2$. Assuming independence, how far away are the observed values from our expected values? The code to answer this again uses the pingouin package:
import pingouin

expected, observed, stats = pingouin.chi2_independence(
    data=stack_overflow,
    x='job_satisfaction',
    y='age_cat'
    )
Calling print(stats(stats['test'] == 'pearson')) yields summary statistics, including the p-value, which is in this case 0.23, leading us to fail to reject the null and believe that the two values are independent. Why do we say that the two values are independent and not that age_cat is independent of job_satisfaction? Well, if you switch the x and y axes, you get the same result. This means we should ask, “Are variables x and y independent?”, not “Is variable y indepdent of variable x?”.
One thing to note here is that we do not need to use a correction. There is the possibility to use Yate’s continuity correction, which is a factor that corrects for when the sample size is very small and the degrees of freedom are 1. However, Chapman doesn’t go much into this use case so I will gloss over it as well. :)
A final note is that in most cases, chi-square tests are right tailed so it is not necessary to declare the alternative for the test.
3. Chi-Square Goodness Of Fit Test for Comparing A Single Categorical Variable to a Hypothesized Distribution
Finally, we can use a chi-square goodness-of-fit test to compare a single categorical variable to a hypothesized distribution. Let’s say we have a categorical variable with four values. We believe the distribution of these values is [1/2, 1/6, 1/6, 1/6]. We use a goodness of fit test to check this hypothesis.
\(H_0: \text{Our sample matches the hypothesized distribution.}\) \(H_A: \text{Our sample does not match the hypothesized distribution.}\)
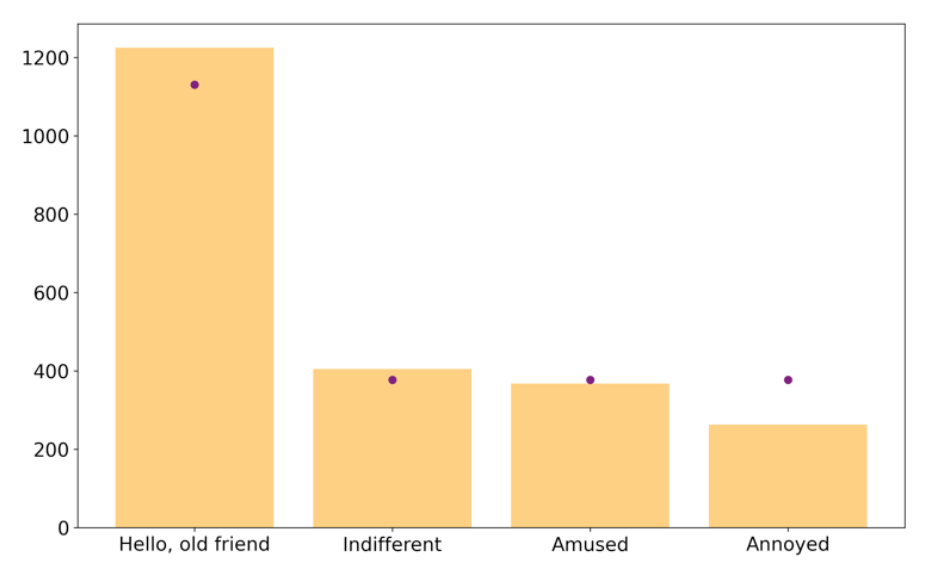
$\chi^2$ again measures how far the observed results are from the expectations of each group. Let’s choose an $\alpha$ of $0.1$. Again, we want to visualize what we are talking about. For now, don’t worry about the categorical value names (if you’re really curious, take the course or find the Stack Overflow data yourself). The below code will generate the following image, which shows the sample distribution as bars in orange and the hypothesized distribution as points in purple.
import matplotlib as plt
plt.bar(purple_link_counts['purple_link'],
        purple_link_counts['n'],
        color='orange',
        alpha=0.5
        )
plt.scatter(hypothesized['purrple_link'],
            hypothesized['n'],
            color='purple'
        )
plt.show()

As you can see, two of the points appear to match up with the hypothesized values of 1/6, but the final value is a bit less than 1/6 and the first value is a bit more than 1/2. Is this significantly different than our hypothesized distribution or not? Let’s find out!
from scipy.stats import chisquare

chisquare(f_obs=purple_link['n'],
          f_exp=hypothesized['n']
          )
Our p-value is small (in this case, 1.126e-09), leading us to reject the null hypothesis and believe that the sample distribution does not match our hypothesized distribution. How cool??
Well, that’s it for now folks. This time we went over estimating a population parameter without using a bootstrap distribution, comparing two proportions without using a bootstrap distribution, the chi-square test of independence for proportions of more than two groups, and the chi-square goodness of fit test for a single proportion against a given distribution. Next time we’ll wrap up with part four, which dives into non-parametric tests, which is what you would use as an alternative when the tests we’ve learned about so far cannot be used because certain assumptions are not met.
Until next time!
–Em