Hypothesis Testing: T-Tests, ANOVA, and Paired T-Tests
This post is the second of a four-part series on Hypothesis Testing. Part 1 here. Part 3 here. Part 4 here.
Welcome back to my journey through prepping for the Google Product Analyst interview! In this post, we are building on our previous knowledge to expand our hypothesis testing practices to three new types of tests: the t-test, ANOVA, and the paired t-test. I’ll go through how to perform each of these tests and when to use them.
As a reminder, this blog post is a review of the DataCamp course Hypothesis Testing in Python taught by James Chapman. However, you don’t need to have DataCamp access in order to follow along with the concepts presented here.
As a refresher, here is the order of operations for performing a hypothesis test. Don’t forget to set an $\alpha$ value in the beginning for your significance level!
- identify population parameter that is hypothesized about
- Specify the null and alternative hypotheses ($H_0$ and $H_A$)
- Determine the standardized test statistic and corresponding null distribution (in our previous example, this was the z-score and the normal distribution – but heads up! This will change in our following examples.)
- Conduct hypothesis test in Python
- Measure evidence against the null hypothesis (Is the p-value lower than your significance level?)
- Make a decision comparing evidence to significance level.
- Interpret the results in the context of the original problem.
1. T-Test
Last time, we used the z-score to measure the difference between a single proportion and a hypothesized value. In this case, we are interested in the difference between the means of two populations. As an example, Chapman has a dataset collected by Stack Overflow about data scientists. In it, the compensation level for each respondent is reported, as well as the answer to the question we considered in the previous post – did the user begin programming before or after age 14? We could ask the question, do data scientists who began programming as a child (before age 14) earn more on average than those who started programming as an adult (14 or older)? For this we would have the following null and alternative hypotheses, written in both words and in math:
$H_0$: The mean compensation is the same for those that coded first as a child and those that coded as an adult. $H_0: \mu_{child} = \mu_{adult}$
$H_A$: The mean compensation is greater for those that coded first as a child compared to those that began coding as an adult. $H_A: \mu_{child} > \mu_{adult}$
Again, we are trying to determine an unknown population mean from the sample statistics. Please note that we can rewrite the equations for $H_0$ and $H_A$ as follows:
$H_0: \mu_{child} - \mu_{adult} = 0$ $H_A: \mu_{child} - \mu_{adult} > 0$
Assuming our dataset is named stack_overflow, the column for when a respondent began programming is age_first_code_cut and the compensation column is compensation, the Python to get the means for each group would be as follows:
stack_overflow.groupby('age_first_code_cut')['compensation'].mean()
resulting in the following output:
adult   $111,313
child   $132,419
Obviously, these numbers are different. But are they statistically significantlly different? Or could it be explained by sampling variability?
To answer this question, we will run a t-test. To run a t-test, you need to first find the test statistic, then standardize it, similar to the proportions test. This time, our equation is as follows:
\[\frac{\text{difference in sample statistics - difference in population parameters}}{\text{standard error}}\]Alternatively, this can be written as:
\[\frac{(\bar{x}_{child} - \bar{x}_{adult}) - (\mu_{child} - \mu_{adult})}{SE(\bar{x}_{child} - \bar{x}_{adult})}\]But wait!, I can hear you say, how can we use $\mu_{child} - \mu_{adult}$ in our equation if we don’t know the population parameters? Excellent question. Thankfully, since we are assuming $H_0$ to be true, that term goes away since $\mu_{child} - \mu_{adult} = 0$ in the $H_0$ case.
Previously, we calculated the standard error from a bootstrap distribution, but this can be computationally expensive. As an alternative, when we have two samples, we can approximate the standard error by the following equation:
\[SE(\bar{x}_{child} - \bar{x}_{adult}) \approx \sqrt{\frac{s^2_{child}}{n_{child}} + \frac{s^2_{adult}}{n_{adult}}}\]Thus, we can calculate the t-statistic using the following six variables, all of which we can calculate from the sample:
\[\frac{\bar{x}_{child} - \bar{x}_{adult}}{\sqrt{\frac{s^2_{child}}{n_{child}} + \frac{s^2_{adult}}{n_{adult}}}}\]The T-distribution
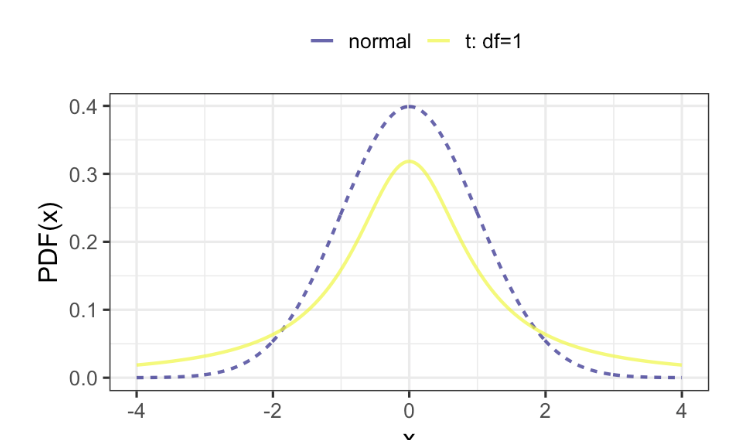
To get the p-value, instead of plugging this in to the CDF of the normal distribution like we did with the z-score, we will plug it into the CDF of the t-distribution. The t-distribution takes one parameter, degrees of freedom, which I’ll show you how to calculate in the following section. For now, examine the graph below of the t-distribution with one degree of freedom:

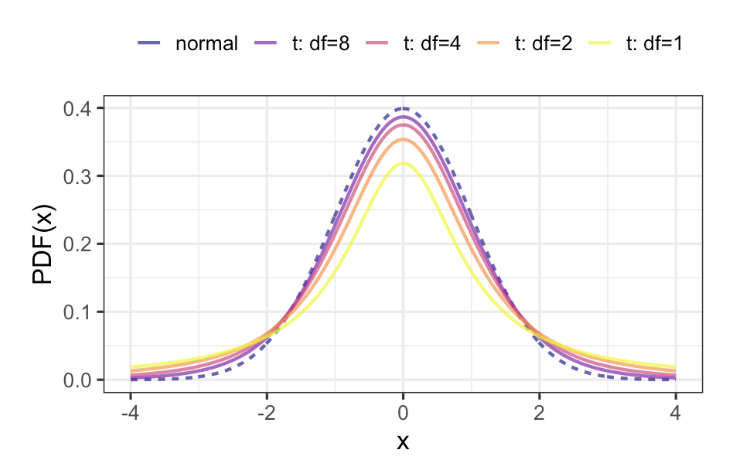
Notice how the t-distribution looks a lot like the normal distribution, but with fatter tails. Here’s what happens as the degrees of freedom increases:

As the degrees of freedom increases, the t-distribution approximates the normal distribution. In fact, the normal distribution is simply the t-distribution with infinite degrees of freedom.
The code to get the p-value from the t-distribution is as follows:
from scipy.stats import t
1-t.cdf(t_statistic, df=degrees_of_freedom)
Again, you’ll then compare the p-value to your significance level. If the p-value is below alpha, you will reject the null hypothesis. Otherwise, you fail to reject the null hypothesis and the values are the same.
Degrees of Freedom
So, what exactly are degrees of freedom? The degrees of freedom are the maximum number of logically independent values in the data sample. Consider five numbers, [1, 2, 3, 4, 5]. If you know four of the numbers and the mean of the sample, the fifth number is no longer independent. Hence, the degrees of freedom will be $n-1$. For the two-sample case, $df = n_{child} + n_{adult} - 2$.
2. Paired T-Test
Sometimes, the two datasets you want to compare are paired. An example of this might be students’ test scores at the beginning and end of a course. Since the same student is taking the first and last exam, the data are paired along the axis of students. This is because there may be some variation in one how student performs from another. To handle this, you would take the difference of the two values and use that as your test statistic. Since we now have only one value for the test statistic, the difference, the degrees of freedom is now $n_{diff} - 1$.
As an alternative to using scipy, Chapman introduces the pingouin package. This package provides a ttest function which can be used as follows to perform a paired t-test:
import pingouin

pingouin.ttest(
    x = sample_data['students_test_score_before'],
    y = sample_data['students_test_score_after'],
    paired = True,
    alternative = 'less'
    )
Try running this on your own favorite paired dataset with both paired = True and paired = False. Please note that unpaired t-tests on paired data increases the risk of false negative errors.
3. Analysis of Variance (ANOVA) test
So far, we’ve looked at proportion tests (one test statistic), t-tests (two test statistics), and paired t-tests (two test statistics that are related). Another situation to consider is a test statistic across more than two categories. For instance, going back to the Stack Overflow data about data scientists’ compensation. There is a column that reports job satisfaction on a five-point scale from “not satisfied” to “very satisfied”. What if we want to know if there is a difference in compensation across any of the five job satisfaction levels?
What we would do is an analysis of variance (ANOVA) test. This can compare a value across more than two dimensions of a categorical variable. Just as before, we select a significance level. For this one, we’ll choose 0.2. The code is as follows:
import pingouin

pingouin.anova(
    data = stack_overflow,
    dv = 'compensation',
    between = 'job_satisfaction'
    )
Let’s say the output of this shows us a p-value of 0.001 which is much less than our significance level of 0.2. This means at least 2 categories of job satisfaction have significantly different compensation levels. However, it doesn’t tell us which categories. In order to do that, we have to perform pairwise tests across all combinations.
For five levels, there are ten combinations we need to perform. However, as the number of groups increases, the number of pairs increases quadratically. The more tests that are run, the higher th chance of a false positive. To correct for this, we need to adjust using the parameter padjust. There are many different kinds of corrections we can use, but in this course, we only use the one-step Bonferroni correction. This can be set using padjust='bonf'. Others include Sidak, step-down Bonferroni, Benjamin/Hochberg FDR correction and the Benjamin/Yekutieli FDR correction. To be quite honest, I don’t know anything about the difference in these types of corrections and the course doesn’t go into it, so this is a deep dive for another day and another blog post. For now, here’s the code for pairwise t-tests:
import pingouin

pingouin.pairwise_ttests(
    data=stack_overflow,
    dv='compensation',
    between='job_satisfaction',
    padjust='bonf'
    )
In the above code snippits, dv stands for dependent variable.
Well, there you have it! We covered t-tests, paired t-tests, and ANOVA tests. Next up we will dive into chi-square independence tests for difference of proportions between more than two groups, and chi-square goodness of fit tests for the one-sample case.
Until next time!
–Em